CSV文件數據圖形化工具?
相關文檔: 設計自己的Trait編輯器
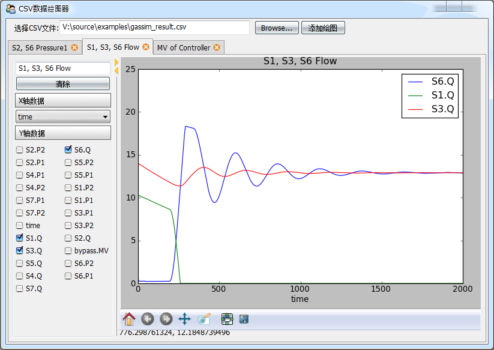
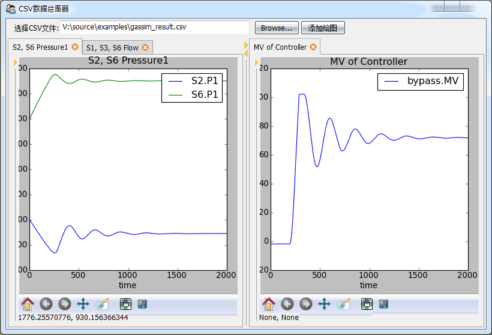
采用 在traitsUI中使用的matplotlib控件 制作的CSV文件數據繪圖工具。
# -*- coding: utf-8 -*-
from matplotlib.figure import Figure
from mpl_figure_editor import MPLFigureEditor
from enthought.traits.ui.api import *
from enthought.traits.api import *
import csv

class DataSource(HasTraits):
    """
    數據源,data是一個字典,將字符串映射到列表
    names是data中的所有字符串的列表
    """
    data = DictStrAny
    names = List(Str)

    def load_csv(self, filename):
        """
        從CSV文件讀入數據,更新data和names屬性
        """
        f = file(filename)
        reader = csv.DictReader(f)
        self.names = reader.fieldnames
        for field in reader.fieldnames:
            self.data[field] = []
        for line in reader:
            for k, v in line.iteritems():
                self.data[k].append(float(v))
        f.close()

class Graph(HasTraits):
    """
    繪圖組件,包括左邊的數據選擇控件和右邊的繪圖控件
    """
    name = Str # 繪圖名,顯示在標簽頁標題和繪圖標題中
    data_source = Instance(DataSource) # 保存數據的數據源
    figure = Instance(Figure) # 控制繪圖控件的Figure對象
    selected_xaxis = Str # X軸所用的數據名
    selected_items = List # Y軸所用的數據列表

    clear_button = Button(u"清除") # 快速清除Y軸的所有選擇的數據

    view = View(
        HSplit( # HSplit分為左右兩個區域,中間有可調節寬度比例的調節手柄
            # 左邊為一個組
            VGroup(
                Item("name"),   # 繪圖名編輯框
                Item("clear_button"), # 清除按鈕
                Heading(u"X軸數據"),  # 靜態文本
                # X軸選擇器,用EnumEditor編輯器,即ComboBox控件,控件中的候選數據從
                # data_source的names屬性得到
                Item("selected_xaxis", editor=
                    EnumEditor(name="object.data_source.names", format_str=u"%s")),
                Heading(u"Y軸數據"), # 靜態文本
                # Y軸選擇器,由于Y軸可以多選,因此用CheckBox列表編輯,按兩列顯示
                Item("selected_items", style="custom",
                     editor=CheckListEditor(name="object.data_source.names",
                            cols=2, format_str=u"%s")),
                show_border = True, # 顯示組的邊框
                scrollable = True,  # 組中的控件過多時,采用滾動條
                show_labels = False # 組中的所有控件都不顯示標簽
            ),
            # 右邊繪圖控件
            Item("figure", editor=MPLFigureEditor(), show_label=False, width=600)
        )
    )

    def _name_changed(self):
        """
        當繪圖名發生變化時,更新繪圖的標題
        """
        axe = self.figure.axes[0]
        axe.set_title(self.name)
        self.figure.canvas.draw()

    def _clear_button_fired(self):
        """
        清除按鈕的事件處理
        """
        self.selected_items = []
        self.update()

    def _figure_default(self):
        """
        figure屬性的缺省值,直接創建一個Figure對象
        """
        figure = Figure()
        figure.add_axes([0.05, 0.1, 0.9, 0.85]) #添加繪圖區域,四周留有邊距
        return figure

    def _selected_items_changed(self):
        """
        Y軸數據選擇更新
        """
        self.update()

    def _selected_xaxis_changed(self):
        """
        X軸數據選擇更新
        """
        self.update()

    def update(self):
        """
        重新繪制所有的曲線
        """
        axe = self.figure.axes[0]
        axe.clear()
        try:
            xdata = self.data_source.data[self.selected_xaxis]
        except:
            return
        for field in self.selected_items:
            axe.plot(xdata, self.data_source.data[field], label=field)
        axe.set_xlabel(self.selected_xaxis)
        axe.set_title(self.name)
        axe.legend()
        self.figure.canvas.draw()


class CSVGrapher(HasTraits):
    """
    主界面包括繪圖列表,數據源,文件選擇器和添加繪圖按鈕
    """
    graph_list = List(Instance(Graph)) # 繪圖列表
    data_source = Instance(DataSource) # 數據源
    csv_file_name = File(filter=[u"*.csv"]) # 文件選擇
    add_graph_button = Button(u"添加繪圖") # 添加繪圖按鈕

    view = View(
        # 整個窗口分為上下兩個部分
        VGroup(
            # 上部分橫向放置控件,因此用HGroup
            HGroup(
                # 文件選擇控件
                Item("csv_file_name", label=u"選擇CSV文件", width=400),
                # 添加繪圖按鈕
                Item("add_graph_button", show_label=False)
            ),
            # 下部分是繪圖列表,采用ListEditor編輯器顯示
            Item("graph_list", style="custom", show_label=False,
                 editor=ListEditor(
                     use_notebook=True, # 是用多標簽頁格式顯示
                     deletable=True, # 可以刪除標簽頁
                     dock_style="tab", # 標簽dock樣式
                     page_name=".name") # 標題頁的文本使用Graph對象的name屬性
                )
        ),
        resizable = True,
        height = 0.8,
        width = 0.8,
        title = u"CSV數據繪圖器"
    )

    def _csv_file_name_changed(self):
        """
        打開新文件時的處理,根據文件創建一個DataSource
        """
        self.data_source = DataSource()
        self.data_source.load_csv(self.csv_file_name)
        del self.graph_list[:]

    def _add_graph_button_changed(self):
        """
        添加繪圖按鈕的事件處理
        """
        if self.data_source != None:
            self.graph_list.append( Graph(data_source = self.data_source) )

if __name__ == "__main__":
    csv_grapher = CSVGrapher()
    csv_grapher.configure_traits()