在traitsUI中使用的matplotlib控件?
相關文檔: 設計自己的Trait編輯器
在traitsUI所產生的界面中嵌入matplotlib的控件。
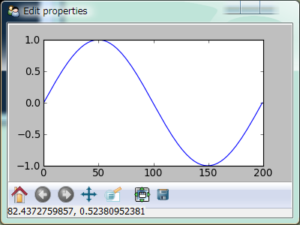
# -*- coding: utf-8 -*-
# file name: mpl_figure_editor.py
import wx
import matplotlib
# matplotlib采用WXAgg為后臺,這樣才能將繪圖控件嵌入以wx為后臺界面庫的traitsUI窗口中
matplotlib.use("WXAgg")
from matplotlib.backends.backend_wxagg import FigureCanvasWxAgg as FigureCanvas
from matplotlib.backends.backend_wx import NavigationToolbar2Wx
from enthought.traits.ui.wx.editor import Editor
from enthought.traits.ui.basic_editor_factory import BasicEditorFactory

class _MPLFigureEditor(Editor):
    """
    相當于wx后臺界面庫中的編輯器,它負責創建真正的控件
    """
    scrollable = True

    def init(self, parent):
        self.control = self._create_canvas(parent)
        self.set_tooltip()
        print dir(self.item)

    def update_editor(self):
        pass

    def _create_canvas(self, parent):
        """
        創建一個Panel, 布局采用垂直排列的BoxSizer, panel中中添加
        FigureCanvas, NavigationToolbar2Wx, StaticText三個控件
        FigureCanvas的鼠標移動事件調用mousemoved函數,在StaticText
        顯示鼠標所在的數據坐標
        """
        panel = wx.Panel(parent, -1, style=wx.CLIP_CHILDREN)
        def mousemoved(event):
            panel.info.SetLabel("%s, %s" % (event.xdata, event.ydata))
        panel.mousemoved = mousemoved
        sizer = wx.BoxSizer(wx.VERTICAL)
        panel.SetSizer(sizer)
        mpl_control = FigureCanvas(panel, -1, self.value)
        mpl_control.mpl_connect("motion_notify_event", mousemoved)
        toolbar = NavigationToolbar2Wx(mpl_control)
        sizer.Add(mpl_control, 1, wx.LEFT | wx.TOP | wx.GROW)
        sizer.Add(toolbar, 0, wx.EXPAND|wx.RIGHT)
        panel.info = wx.StaticText(parent, -1)
        sizer.Add(panel.info)

        self.value.canvas.SetMinSize((10,10))
        return panel

class MPLFigureEditor(BasicEditorFactory):
    """
    相當于traits.ui中的EditorFactory,它返回真正創建控件的類
    """
    klass = _MPLFigureEditor

if __name__ == "__main__":
    from matplotlib.figure import Figure
    from enthought.traits.api import HasTraits, Instance
    from enthought.traits.ui.api import View, Item
    from numpy import sin, cos, linspace, pi

    class Test(HasTraits):
        figure = Instance(Figure, ())
        view = View(
            Item("figure", editor=MPLFigureEditor(), show_label=False),
            width = 400,
            height = 300,
            resizable = True)
        def __init__(self):
            super(Test, self).__init__()
            axes = self.figure.add_subplot(111)
            t = linspace(0, 2*pi, 200)
            axes.plot(sin(t))

    Test().configure_traits()