三維標量場觀察器?
相關文檔: 將Mayavi嵌入到界面中
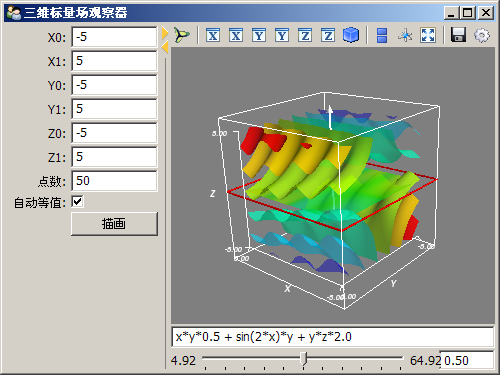
# -*- coding: utf-8 -*-
import numpy as np
from numpy import *

from enthought.traits.api import *
from enthought.traits.ui.api import *
from enthought.tvtk.pyface.scene_editor import SceneEditor
from enthought.mayavi.tools.mlab_scene_model import MlabSceneModel
from enthought.mayavi.core.ui.mayavi_scene import MayaviScene

class FieldViewer(HasTraits):
    """三維標量場觀察器"""

    # 三個軸的取值范圍
    x0, x1 = Float(-5), Float(5)
    y0, y1 = Float(-5), Float(5)
    z0, z1 = Float(-5), Float(5)
    points = Int(50) # 分割點數
    autocontour = Bool(True) # 是否自動計算等值面
    v0, v1 = Float(0.0), Float(1.0) # 等值面的取值范圍
    contour = Range("v0", "v1", 0.5) # 等值面的值
    function = Str("x*x*0.5 + y*y + z*z*2.0") # 標量場函數
    plotbutton = Button(u"描畫")
    scene = Instance(MlabSceneModel, ()) # mayavi場景

    view = View(
        HSplit(
            VGroup(
                "x0","x1","y0","y1","z0","z1",
                Item('points', label=u"點數"),
                Item('autocontour', label=u"自動等值"),
                Item('plotbutton', show_label=False),
            ),
            VGroup(
                Item(name='scene',
                    editor=SceneEditor(scene_class=MayaviScene), # 設置mayavi的編輯器
                    resizable=True,
                    height=300,
                    width=350
                ), 'function',
                Item('contour',
                    editor=RangeEditor(format="%1.2f",
                        low_name="v0", high_name="v1")
                ), show_labels=False
            )
        ),
        width = 500, resizable=True, title=u"三維標量場觀察器"
    )

    def _plotbutton_fired(self):
        self.plot()

    def _autocontour_changed(self):
        "自動計算等值平面的設置改變事件響應"
        if hasattr(self, "g"):
            self.g.contour.auto_contours = self.autocontour
            if not self.autocontour:
                self._contour_changed()

    def _contour_changed(self):
        "等值平面的值改變事件響應"
        if hasattr(self, "g"):
            if not self.g.contour.auto_contours:
                self.g.contour.contours = [self.contour]

    def plot(self):
        "繪制場景"
        # 產生三維網格
        x, y, z = mgrid[
            self.x0:self.x1:1j*self.points,
            self.y0:self.y1:1j*self.points,
            self.z0:self.z1:1j*self.points]
        scalars = eval(self.function) # 根據函數計算標量場的值
        self.scene.mlab.clf() # 清空當前場景

        # 繪制等值平面
        g = self.scene.mlab.contour3d(x, y, z, scalars, contours=8, transparent=True)
        g.contour.auto_contours = self.autocontour
        self.scene.mlab.axes() # 添加坐標軸

        # 添加一個X-Y的切面
        s = self.scene.mlab.pipeline.scalar_cut_plane(g)
        cutpoint = (self.x0+self.x1)/2, (self.y0+self.y1)/2, (self.z0+self.z1)/2
        s.implicit_plane.normal = (0,0,1) # x cut
        s.implicit_plane.origin = cutpoint

        self.g = g
        self.scalars = scalars
        # 計算標量場的值的范圍
        self.v0 = np.min(scalars)
        self.v1 = np.max(scalars)

app = FieldViewer()
app.configure_traits()